Grafana 11.4 is here! Features new unified alerts distribution, better incident response via mobile app, and more. Learn more →
Full-stack observability with actually useful AI
Grafana Cloud: Cost-efficient by design. Built on open standards.
The Free Forever plan
Get started free
Plans to suit every scale
Compare plans
The AI-ha! moment
Cost sanity
Even execs get it
Humblebrag

Your data speaks SQL. Our AI speaks human. Find and fix issues fast with Grafana Cloud AI Assistant →
![]() Ask AI What is the easiest way to get started with observability?
Ask AI What is the easiest way to get started with observability?
Trusted by everyone from startups to the Fortune 500


See clearly. Act faster. Spend smarter.

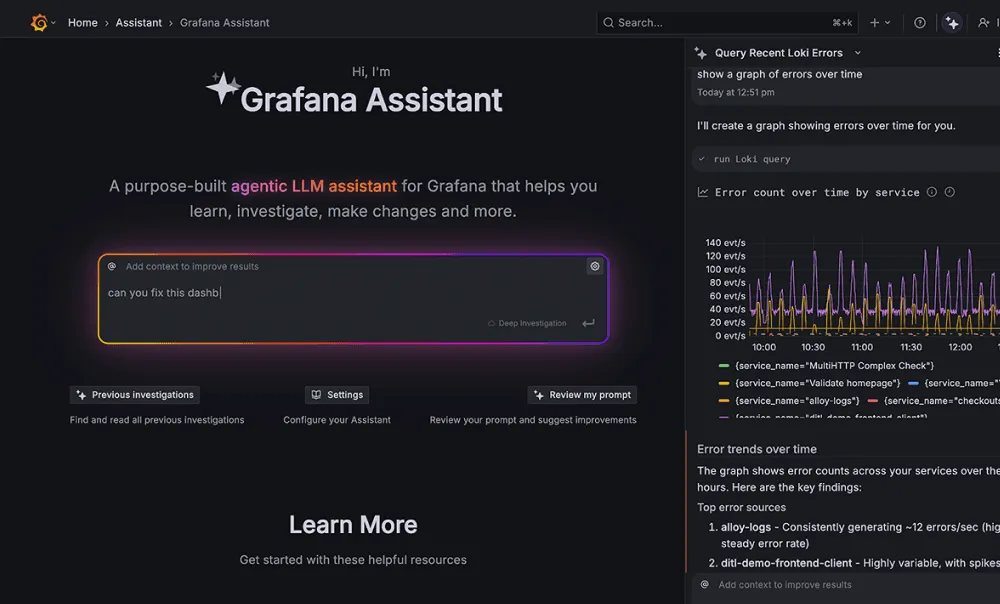
No hype, just actually useful AI
Whether you’re an experienced SRE or new to Grafana, our built-in AI helps you build dashboards, find and fix issues faster, and get instant answers for your most complex queries. All in an easy chat.
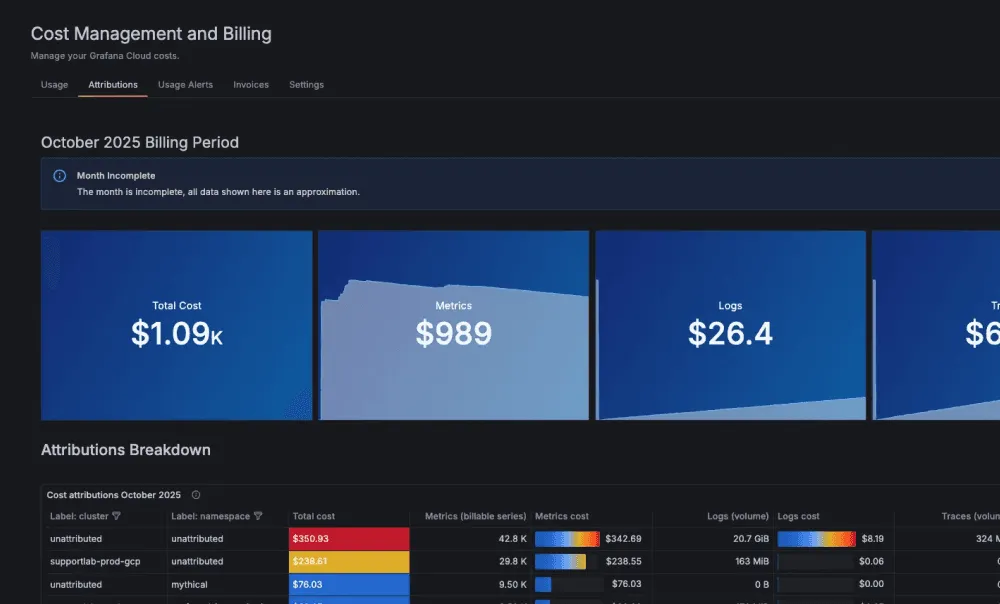

Cut costs. Only pay for the data that matters.
Half of telemetry spend is wasted. Grafana Cloud’s Adaptive Telemetry suite automatically identifies the data worth your attention and aggregates the rest, cutting your telemetry costs by up to 80%.

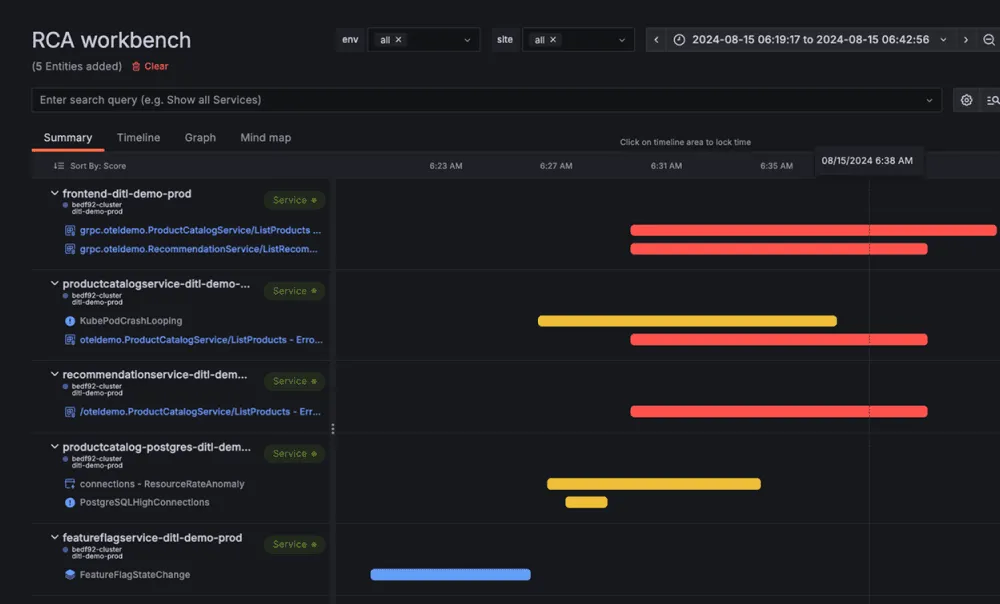
Break down data silos. Troubleshoot faster.
Too many tools and data silos? Grafana Cloud unifies telemetry signals into one clear map so your teams can move faster and operate with confidence.
Plug in, not lock in
Connect your existing tools and data sources to Grafana Cloud — no rip-and-replace required. Built on open standards like OpenTelemetry and Prometheus, with hundreds of plugins and integrations ready to extend your stack.
Observe everything.
Solve anything.
Our open observability cloud includes incident response, testing, synthetic monitoring, and more, built on open standards and usable by individual teams or across an organization.
Products & Solutions
Telemetry
Secure. Compliant. Proven.


Demo time: Try Grafana Cloud
Jump right in, no registration required.
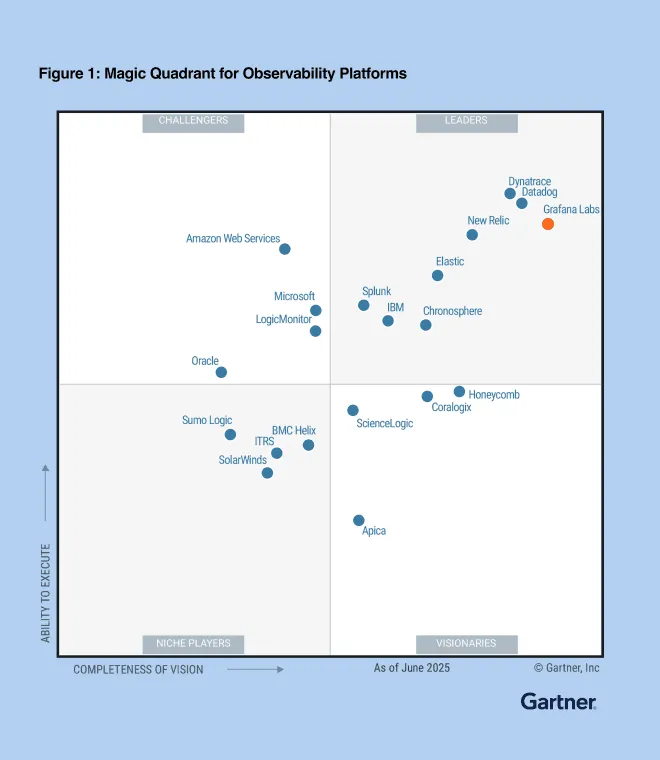
Leader in the 2025 Gartner® Magic Quadrant™ for Observability Platforms
Gartner evaluated 20 vendors based on their Ability to Execute and Completeness of Vision, and Grafana Labs was positioned furthest in Completeness of Vision.
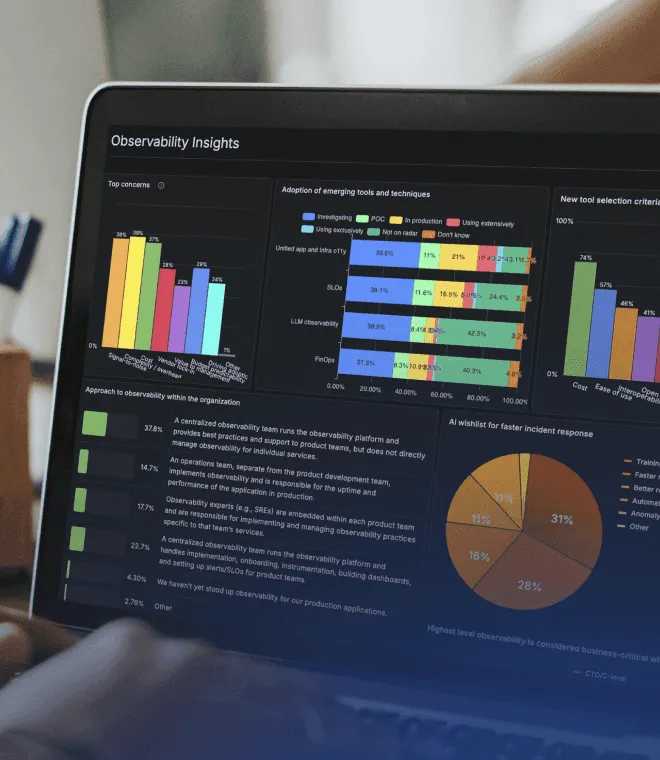
Insights on the state of observability
Explore insights from the industry’s largest community-driven survey on the evolving state of observability.
Real stories from real customers
BlackRock
Pegasystems
Lovable
LATAM Airlines
Delivery Hero
"This platform is about extracting more information, more connectivity, more value...things that our SREs are beating down the door for us to do. [The constant product evolution] has kept us really excited and we continue to be excited."
Olin Gay
Head of Observability, BlackRock
Built on open source. Driven by community.
Our community pushes the product forward, inspires new ideas, and helps us create better tools for everyone who cares about data and observability.


Welcome to
The open observability cloud
Built on open source, open standards, and open ecosystems.
The Free Forever plan
Create free account
Plans to suit every scale
Explore Cloud plans

Still have questions?
Ask your questions. Let AI do the heavy lifting.
![]() How do I get started with Grafana?
How do I get started with Grafana?
Grafana Cloud
Overview
Pricing
What's new in Cloud
AI Assistant
Application Observability
Kubernetes Monitoring
Dashboards & Visualization
Database Observability
Frontend Observability
Synthetic Monitoring
Performance & Load Testing
Incident Response & Management
Cloud integrations
Grafana Cloud Status
Solutions
AI Observability
Full-Stack Observability
Infrastructure & Cloud Observability
Digital Experience Monitoring
Scaled Prometheus
Cost Management & Optimization
Site Reliability
Log Management
Migrate to OpenTelemetry
Integrations
All integrations
All Plugins
AWS
Google Cloud
Microsoft Azure
Kubernetes
Datadog
New Relic
Open Source
Our Projects
Github
Downloads
Dashboard Templates
Learn
Documentation
Blog
Community
Events
Observability Survey & Report
Company
About Grafana Labs
Careers
Partnerships
Newsroom
Success Stories
Contact Us
Get avg. help
Professional Services
Buy ID
Compare
Datadog vs. Grafana Cloud
Dynatrace vs. Grafana Cloud
Elasticsearch vs. Grafana Cloud
New Relic vs. Grafana Cloud
PagerDuty vs. Grafana Cloud
Splunk vs. Grafana Cloud

Donut take our word for it. Try Grafana Cloud today.
Grafana Cloud Status
Legal & Security
Terms of Service
Privacy Policy
Trademark Policy
Copyright 2024 © Grafana Labs